|
13. Phenogram
A phenogram illustrates the period of the year in which adult butterflies are observed. From it, the starting and finishing date of their active period(s) can be seen and gives a quantitative indication and the period that most of the butterflies are recorded in. In many cases a phenogram is shaped as a double wave suggesting that there is more than one generation per year. But a reliable interpretation of this phenomenon is more difficult than it looks like at first glance.
A phenogram can be constructed if several butterfly watchers send their records to a central registration organisation over a period of many years. This method of data collecting obscures differences from year to year by fluctuations in weather conditions. The time scale of the phenograms presented here are divided in units of ten days; a whole year is divided in 36 decades.
This scale causes difficulties in the interpretation of the figures and it can only be used to represent general patterns. The phenograms are simplified versions after Bos et al. (2006), Cuvelier et al. (2007) and Fichefet et al. (2008). In a few cases there were no phenograms based on observations in the Benelux available, in which case figures have been taken either from Ebert & Rennwald (1991a and b) or personal observations.
In the section on species monographs, the decades are given for the start and the end of the flight period as well as the decade in which most of the butterflies were observed.
Biological background of phenograms
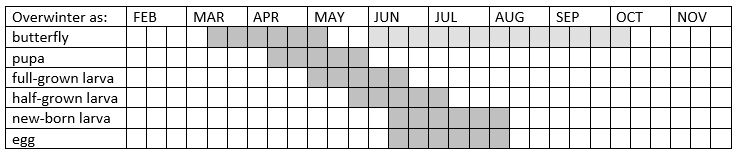
The first step to interpret a phenogram is to consider the overwintering stage. Those species in which the adults overwinter can be observed late in autumn as well as very early in spring. After the spring flight period there is a short period when no butterflies are seen, followed by a period with maximal observations, when the new generation hatches. The species that overwinter in the pupal stage are the heralds of the spring. In early summer those butterflies that overwinter as full-grown larvae appear and later in the year those overwintering as half-grown larva followed by those that overwinter as egg or new-born larva. The latter species will appear in the period of early summer up to late summer, depending on how fast the larvae grow; see figure 13-1.
Figure 13-1. Schedule of butterfly appearance related to the stage in which they overwinter.
| |
Recording of the sightings of butterflies, the year round, produces the figures for the construction of a diagram.
It visualizes the phenological pattern of the occurrence
in adult stage. This can be used to ascertain the butterfly's life cycle, whether it is a univoltine, bivoltine or multivoltine species.
However to interpret such a phenogram may be sometimes very difficult.
|
| |
|
|
|
| |
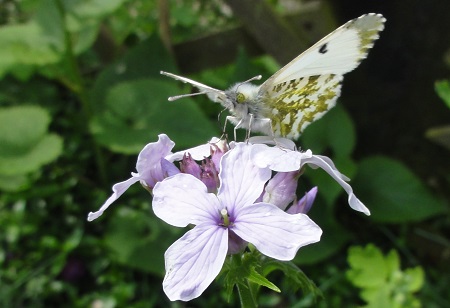
Anthocharis cardamines with one generation a year
Photograph: Rosita Moenen ©. |
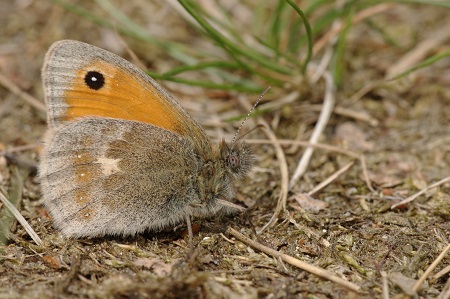
Coenonympha pamphilus with complex generations.
Photograph: Jeroen Voogd ©. |
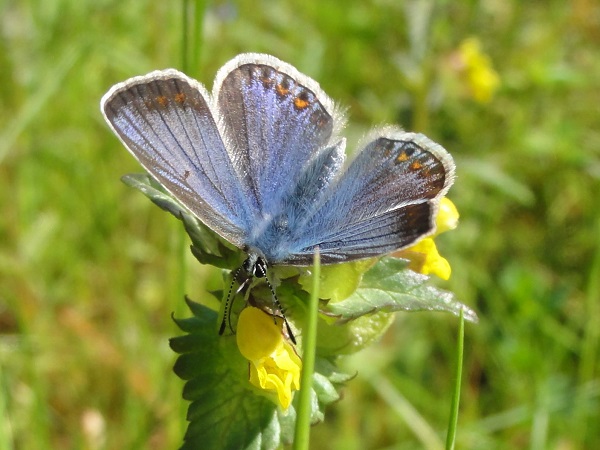
Polyommatuys icarus, a clearly mutibrooded species.
Photograph: Rosita Moenen ©. |
| |
Recording of the sightings of butterflies, the year round, produces the figures for the construction of a diagram.
It visualizes the phenological pattern of the occurrence in adult stage. This can be used to ascertain the butterfly's life cycle, whether it is a univoltine, bivoltine or multivoltine species.
However to interpret such a phenogram may be sometimes very difficult.
A simple one peak phenogram is clear in a single breeding species, such as the orange tip (Anthocharis cardamines).
The double peaked phenogram of the common blue (Polyommatus icarus) also appears easy to interpret but in the case of the small heath (Coenonympha pamphilus)
it proved to be very complicated. |
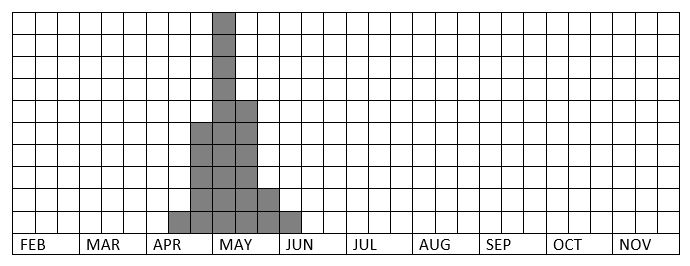
One generation per year
The species occurring in one generation per year produce the typical phenogram of one wave, except for those overwintering as adult. An example of a single brooded (univoltine) species is the orange tip (Anthocharis cardamines) and its phenogram appears easy to interpret. In experiments the longevity of the butterfly proved to be about two to three weeks. However, the flight period read off the phenogram runs from the middle of April up to early in June, altogether about 8 weeks, 5 weeks longer than expected. This could be explained partly by annual variation and partly by differences in the temperature of the hibernation place Experiments have demonstrated that there is also a genetic variation in the duration of the hibernation.; this variation can be more than three weeks and the pupae even may last several years before hatching. These are details that cannot be gained from inspection of the phenogram (see fig. 13-2).
Figure 13-2. Simplified phenogram of the orange tip (Anthocharis cardamines) from national recording data after Bos et al. (2006: 118).
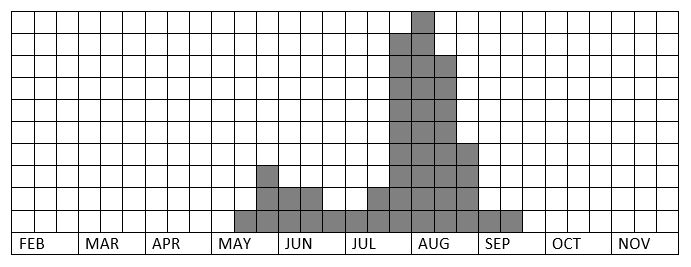
Two or more generations per year
A phenogram that shows two or more waves is usually interpreted as presenting a double or multi brooded species. This appears to be correct in the case of the common blue (Polyommatus icarus) (see fig. 13-3). The top of the first wave corresponds with the end of May and the top of the second wave with the beginning of August. The period in between is 60 days and equates to the time required for embryonic development, larval feeding time, pupal development and for the butterfly to oviposit. Breeding experiments at an average temperature of 20°C produced a figure of 56 days for the total development from egg to adult. This fits well with the period of 60 days read from the phenogram. The top of the second wave is much higher than that of the first. This is the result of the higher reproduction success in the summer.
A breeding experiment at an average temperature of 23°C produced a figure of 46 days, ten days shorter; thus in a phenogram the top of the second wave will be considerable earlier. This is a well-known phenomenon in a very warm year.
In a cold year development may be expected to take about 93 days, under such circumstances a second brood fails to occur because all larvae will hibernate as a result of shortened daylight late in the season.
Figure 13-3. Simplified phenogram of common blue (Polyommatus icarus) from national recording data after Bos et al. (2006: 204).
Complex generations
From breeding experiments it has been shown that a phenogram apparently representing a univoltine species should be studied carefully. A phenogram based on records over a long period may show clearly a double wave but this may not necessarily be a the result of two broods.
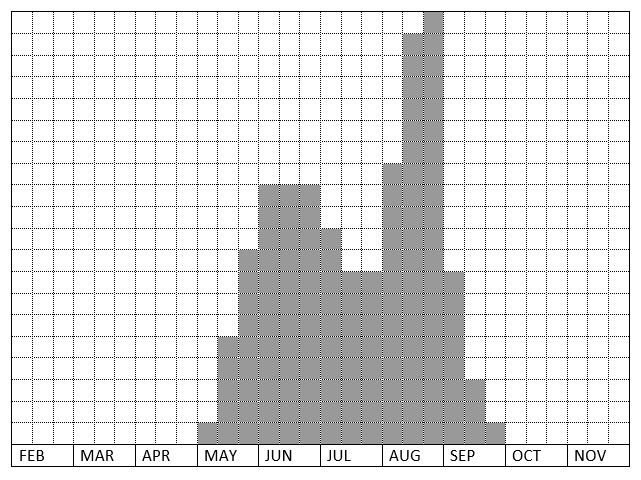
The general phenogram of the small heath (Coenonympha pamphilus) (fig. 13-4) after Bos et al (2006: 223) shows that the peak of the first wave occurs during the second decade of June and that of the second wave in the of August. The long period in between of 60 days strongly suggests the occurrence of a second generation.
Figure 13-4. Simplified phenogram of small heath (Coenonympha pamphilus) from national recording data after Bos et al. (2006: 223).
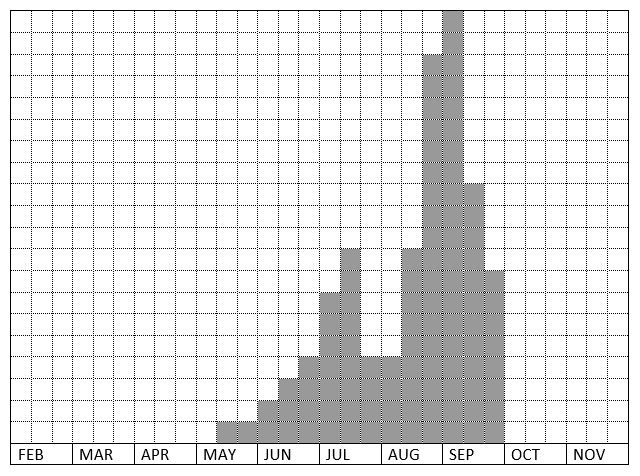
Apart from the general phenogram of the small heath another one has been produced based on data recorded over one year of monitoring along a butterfly-counting transect in the national park of Hoge Veluwe by Chris van de Bunt in 1995 (see figure 13-5). This phenogram differs markedly from the general one; the top of the first wave is in the middle decade of June and that of the second wave early in September. This time interval is about 50 days and corresponds with the time required for larval development obtained from a breeding experiment.
In the year in which the transect was undertaken, the meteorological institute KNMI recorded average temperatures of 12.8°C for May and 14.7°C for June. These values were lower than normal and thus caused a delay in appearance of the adult butterfly. The average temperatures for July was 20.1°C and for August 19.7°C, both higher than normal. This comparatively warm summer explains the peak at the beginning of September.
Are the two peaks in both phenograms the result of two generations?
Experimental data demonstrated a large variation in the time taken for development. This proved to be determined by the duration of both the hibernation and the larval growth rate.
In the larval stage there was a spread in the reactivation over 66 days early in spring. Diapause is introduced by a specific length of daylight. All larvae that hatched before 12 July (daylight 16 hours and 13 minutes at latitude 52° north) will not hibernate and all larvae that hatch after 3 August (daylight 15 hours 13 minutes) will do so. All butterflies seen during May, June and the beginning of July are of the first brood. In August and September there will be only a partial second brood consisting of larvae hatched before 3 August. So the second emergence is a mixture of butterflies of both generations.
Figure 13-5. Simplified phenogram of small heath (Coenonympha pamphilus) based on observations made along a transect at Hoge Veluwe in 1995,
after Bink 2010b.
Differences per region
In the Benelux, differences in phenograms may occur systematically between the south of Wallonia and the Netherlands. The figures derived from Wallonia (Fichefet et al. 2008) and from the Netherlands (Bos et al. 2006) reflect the difference in climate. In spring many species are earlier on the wing in Wallonia whereas in the Netherland many species are still present later in the autumn.
The phenograms of Wallonia are in general wider than those of Flanders and the Netherlands; this can be explained by the differences in altitude present in Wallonia. The region of the great bogs at 500 m altitude is much cooler than the warm south-facing slopes in the south. In summarized phenograms from different regions these local differences are masked.
|